From Sequence to Phylogenetic Tree
Masterclass
The Problem
Often when trying to analyse sequences of any kind you will find yourself interested in the relationships between them. From trying to infer relatedness between species or trying to figure out which genes have a common origin, a lot of information can be drawn from the pure amino acid or nucleotide composition. One of the most intuitive way of displaying relationships between sequences is a phylogenetic tree, which is exactly what we’re trying to produce in this session.
The Data
The most commonly used way to store biological sequences of any kind is in a fasta. Fasta files usually end in .fa or .faa for amino acids and .fnt for nucleotides. The format itself is nothing more than a header line initiated by a “>” sign followed by a line break and the sequence.
>Sequence1
AGTCCTCCTACGGACTGCGATGACTACGTACGATCGTCGACTGGCTACGTCAGACTCGACATCATGCGAATCATG
AGTCCTCCTACGGACTGCGATGACTACGTACGATCGTCGACTGGCTACGTCAGACTCGACATCATGCGAATCATG
>Sequence2
AGTCCTCCTACGGACTGCGATGACTACGTACGATCGTCGACTGGCTACGTCAGACTCGACATCATGCGAATCATG
AGTCCTCCTACGGACTGCGATGACTACGTACGATCGTCGACTGGCTACGTCAGACTCGACATCATGCGAATCATG
This way we can store a sheer unlimited amount of sequences in one simple file format which is the starting point of most sequence analysis endeavours.
First steps in analysis
Before diving straight into comparing seuences it is a good starting point to look at what information is available about your dataset. Often in bioinformatics we forget about the bio and focus on the informatics, but just because we can do something with a computer doesn’t mean it makes sense from a biological point of view. UniprotKB for example is a very comprehensive database with loads of different forms of annotations and a good ay to learn more about the biology behin the data. If you’re lucky your fasta header contains some form of sequence identifier which can be fed straight into the UniprotKB search bar. For the more unfortunate amongst us there is a BLAST option. BLAST which stands for Basic local alignment search tool is a way to look through any kind of sequence database given a snippet sequence. Its like going into a library with a ripped out page and BLAST is the librarian pointing out which book it came from. In a similar fashion we can take our sequence blast it against all of the UniprotKB and get the most relevant sequence. The main criteria of a good match in BLAST is the expect-value (e-value). The e-value tells you how many matches within the database you expect to see by chance whilst searching. So the lower the e-value the better your match is and the more certain you can be it is not only a random hit. Good BLAST hits typically have an e-value from ~0.0001 downwards.
Ar eally informative sequence featurer which is stored on UniprotKB (and other databases) is the GO term. GO stands for gene ontology and is a way of guessing which function the gene has within the organism. GO terms are hierarchical and depending on what level the particular GO-term is they can be very broad like which metabolic process it is involved in, to very specific functions like binding certain ions. The GO-term can also denote which cellular component your gene is localised. GO is in general very informative but has to be taken with a grain of salt. Often similar sequences are assigned the same GO-terms because it is assumed similar sequences will do similar things in organisms. This is however a simplification, because localisation within the cell and small but important mutations can lead to an entirely different functions. As a heuristic, if your particular sequence is a well research protein like human hemoglobin for example, the GO terms should be very good. If you are looking at a protein from a not well researched genome and the BLAST hit only returns a close relative from a different species, you probably should not pay too much attention to the GO term.
Another gene attribute which is very helpful to look at is the protein domain content. Domains are the building blocks of functions of which genes are made. If the gene was a lego house the domains are the lego blocks. There is a limited amount of domains in all kingdoms of life but almost limitless potential to combine them. By clicking and looking at the descriptions of domains on UniprotKB you can get a very good guess at what functions different parts of your gene fulfill. If two genes have the exact same domains in the same succession there is a good chance at them having similar functions overall. There are different domain databases of which PFam is probably the most widely used. There are two subdatabases within PFAM A and B. A are the more well described protein domains whereas B is still very experimental. In general you should be a bit suspicious of domains from Pfam B.
Once you have explored the information available on your sequence you can head into the first step of creating a tree.
The Alignment
Alignments are created to see which parts of the sequence are homologous. Aligned nucleotides or amino acids are thought have originated from the same nucleotide or amino acids. If you think of the alignment as a matrix all columns present positions which are homologous. If there are different nucleotides or amino acids in one column there was a mutation at this position. If there was a stretch of sequence added or deleted (an insertion or deletion) you introduce gaps (marked by hyphens) into the alignment.
Aligning a set of sequences is a matter of great debate. There are a lot of different opinions out there on what to use where and what counts as a good and bad alignment. A few things up front. Choosing the appropriate aligner depends on what kind of data you have. If you have a lot of sequences (>400) or very long sequences (>1000 bp) I would personally choose Pasta which is a highly efficient aligner. If you want to emphasize insertion and deletion events you should use PRANK which introduces lots of gaps into your sequence. For everything else I would probably use MAFFT. A quick note on how to install most packages in a Linux environment. To install MAFFT you would type in (also all other programs described in this post can be downloaded like this):
sudo apt-get install mafft
MAFFT is fairly easy ot use and well maintained. It also has a –auto argument which sets parameters of the alignment itself by estimating them from the data. On the command line you would use MAFFT like this:
mafft --auto input.fa --thread (number of cores your computer has) > alignment.fa
Which is a good middle ground between being very fast and being very thorough. If you want to force MAFFT to be more thorough you can use something like:
mafft --maxiterate 1000 --globalpair input.fa > alignment.fa
This will give you an alignment in fasta format which you can look at in a text editor but I would seriously recommend looking at it through an alignment viewer. There are again a few opinions out there on what the best alignment viewer is. I usually use JalView which is fairly basic. JalView has a GUI (meaning a graphical user interface) which makes it easier to handle. Load your alignment into JalView (>File>Input alignment) and give it some colouring (>Colour>Percentage Identity). Here you want to check whether your alignment is good enough to create a tree from. What you are hoping for is a lot of identity (a lot of dark shaded blue) and few gaps (little white). For example this is a very good alignment
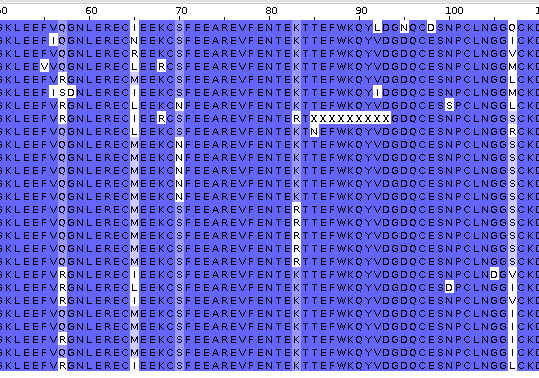
Also in general amino acid alignments tend to be nicer due to less variation like for example in third codon positions. If you have an alignment that satisfies you (anything that is not an ocean of gaps with islands of sequences in between) you can go ahead and make a tree. If you feel like your alignment is not good enough you might want to look at different aligners, changing parameters, or rearranging your dataset (are there sequences which are really distant which could be removed).
The Tree
Again this is a point where there is a good amount of debate out there. In principle there are four different way to construct a tree:
- Distance-matrix based: These methods are very rudimentary in that they try to group the most similar sequences together mainly by looking at how many nucleotides or amino acids are different.
- Maximum Parsimony: These methods try to minimise the amount of evolutionary events (like mutations, insertion and deletions) over the whole tree.
- Maximum Likelihood: Maximum likelihood tries to find amongst all possible trees the one tree which makes your data most probable. A tree which has more mutations will be less likely than one with fewer mutations similar to maximum parsimony. The added benefit however is that Maximum parsimony can account for different speeds of mutation across every single site in your sequence, generally leading to better results.
- Bayesian: Bayesian adds a prior to maximum likelihood. A prior is nothing else than feeding some information that you already have into your tree construction. For example if we align sequences from chimpanzee human and mouse, we can tell the Bayesian approach that the human and chimpanzee sequences are more likely to be more closely related.
In general every approach that is not maximum likelihood or Bayesian is bound to raise a few eyebrows in the community and you will have to do some serious justifying to get it approved. However, you can freely choose between maximum likelihood and Bayesian and every researcher has their own opinion on the matter. In my experience most professors favour Bayesian at the momemnt. The quality of your tree highly depends on the quality of the prior you feed into the Bayesian approach. If you feed no prior Bayesian actually becomes maximum likelihood. Just because it is more easily implemented and takes less time we will use maximum likelihood here. Again there are a few programs out there. If you have a large number of sequences and have limited time FastTree is probably the way to go. In other case but RAxML is probably the most widely accepted method. The command I use is:
raxmlHPC -m PROTGAMMAAUTO -s alignment.fa -n output -p 1 -f a -# 100 -x 1
Lets go through the different arguments. -m denotes the substitution matrix, which is a way to express how likely any given change from one amino acid to another is. PROTGAMMAUTO tells RaxML to estimate this from the data. For nucleotides your best bet is probably GTRGAMMA which is a very general model. You can also use programs like Prottest to estimate the fitting substitution models from your data. -n is the ending of all files that are produced in this run. So in our case all files will end in .output. -f a tells it to use bootstrap. Bootstrap is a way of taking different random subsets from within your data and constructing trees from it. By looking at how many trees end up looking the same you can estimate how robust your tree is statistically. the -# tells RaxML how many times to resample which also controls how many different trees are created. In our case we have a 100 trees which will give every node within the tree a support value of how many trees out of the 100 trees support this particular node. This way we can estimate how much we should trust each individual node which is very important information. As always it depends on the context but a bootstrap value of under 70 is suspicious and you should consider collapsing that note (meaning adding the branches from this node to the previous node resulting in a multiforcation). -p and -x are random seeds. As RAxML uses randomness to create initial guesses at what the right tree might be the random seeds make the results reproducable. Having the same random seed between two RaxML runs will make sure that the same randomness is introduced.
Once RaxML has run it will produce several outfiles. The one you should be interested in and you would want to look at is the .bipartitions.output.
Looking at the Tree
My favourite Tree viewer it ITOL which is online and requires no software to be downloaded. It handles large dataset particularly well. There are loads of features which are really helpful at exploring your tree. For example you could add a dataset with the sequence headers as the first entry in a row and any number or text as the other entries. The numbers will then be displayed as bar charts outside your tree and the text will be yped out. For our tree one of the most informative criteria is the display bootstraps in the advanced section. Here you can visualise how much you should trust every node (even with different colours or shapes). The branch lengths will be mutational differences between sequences and longer branches correspond to more dissimilar sequences. I recommend you load the example dataset of the tree of life and play around with it to see how much ITOL can do. Here is an example of what this could look like:

Written by Nicolas Arning